Web UI
Start server
Command line tools
trackplot --start-server --host 127.0.0.1 --port 5000 --plots ./plots
AppImage (Linux/WSL x86_64 users only)
Download the trackplot appimage file from our release
# example with version v0.3.2, please using your interested version according to your needs
export VERSION=0.3.2
chmod +x trackplot-${VERSION}-x86_64.AppImage
./trackplot-${VERSION}-x86_64.AppImage --help

# startup webserver
./trackplot-${VERSION}-x86_64.AppImage --start-server --host 127.0.0.1 --port 5000 --plots ./plots
Note: the --plots were required while using appimages
Docker image (Strong recommended)
We also prepared a docker image of web server, uses could access this by following this,
docker pull ygidtu/trackplot

# Deploy the server
docker run --name trackplot \
  --rm -v $PWD/example:/data -v $PWD/plots/:/plots -p 5000:5000 ygidtu/trackplot \
  --start-server \
  --host 0.0.0.0 \
  --data /data \
  --plots /plots
-p: public and private port for the server, default:5000(public):5000(private)
- -v, --volume: mount the working directory to docker container, for example, the $PWD/data could replace by the path to your directory contains all necessary data
- --user: prevent docker read and write file using root privileges
- the rest usage please check Command line usage
Usage
1. Main page
The main page of the server, user could click the button to create the plot.

2. Configuration page
At this page, user could see a progress bar at the first tip indicating the progress of the current job.
And next, user should fill in the region of interest at second tip and click the confirm button for downstream analysis.
Please note that the region must follow the pattern, chromosome_id:start_site-end_site:strand.

At third tip, user could reset all configurations for another analysis. please be careful, this reset button will remove all information of previous plot.
3. Choose annotation
At first, user should click the Refernce option to select the genomic annotation file (GTF). And GTF without sorting or bgzipping are both fine for the tool.
Then user could define the parameter at the second tip, and click the confirm button to save the current information for the next step.
For choosing the annotation file, user could paste the absolute path of GTF or choose the file on webpage.

Detailed explanation of configuration

Saved configurations

4. Add plot by set input file
At first, user could choose the different type of plot for each dataset, and then prepare the parameter of each tract.

Please note that before processing another track, user should click the confirm button to save the current tract information.

For another track, the document of parameter refer to here.
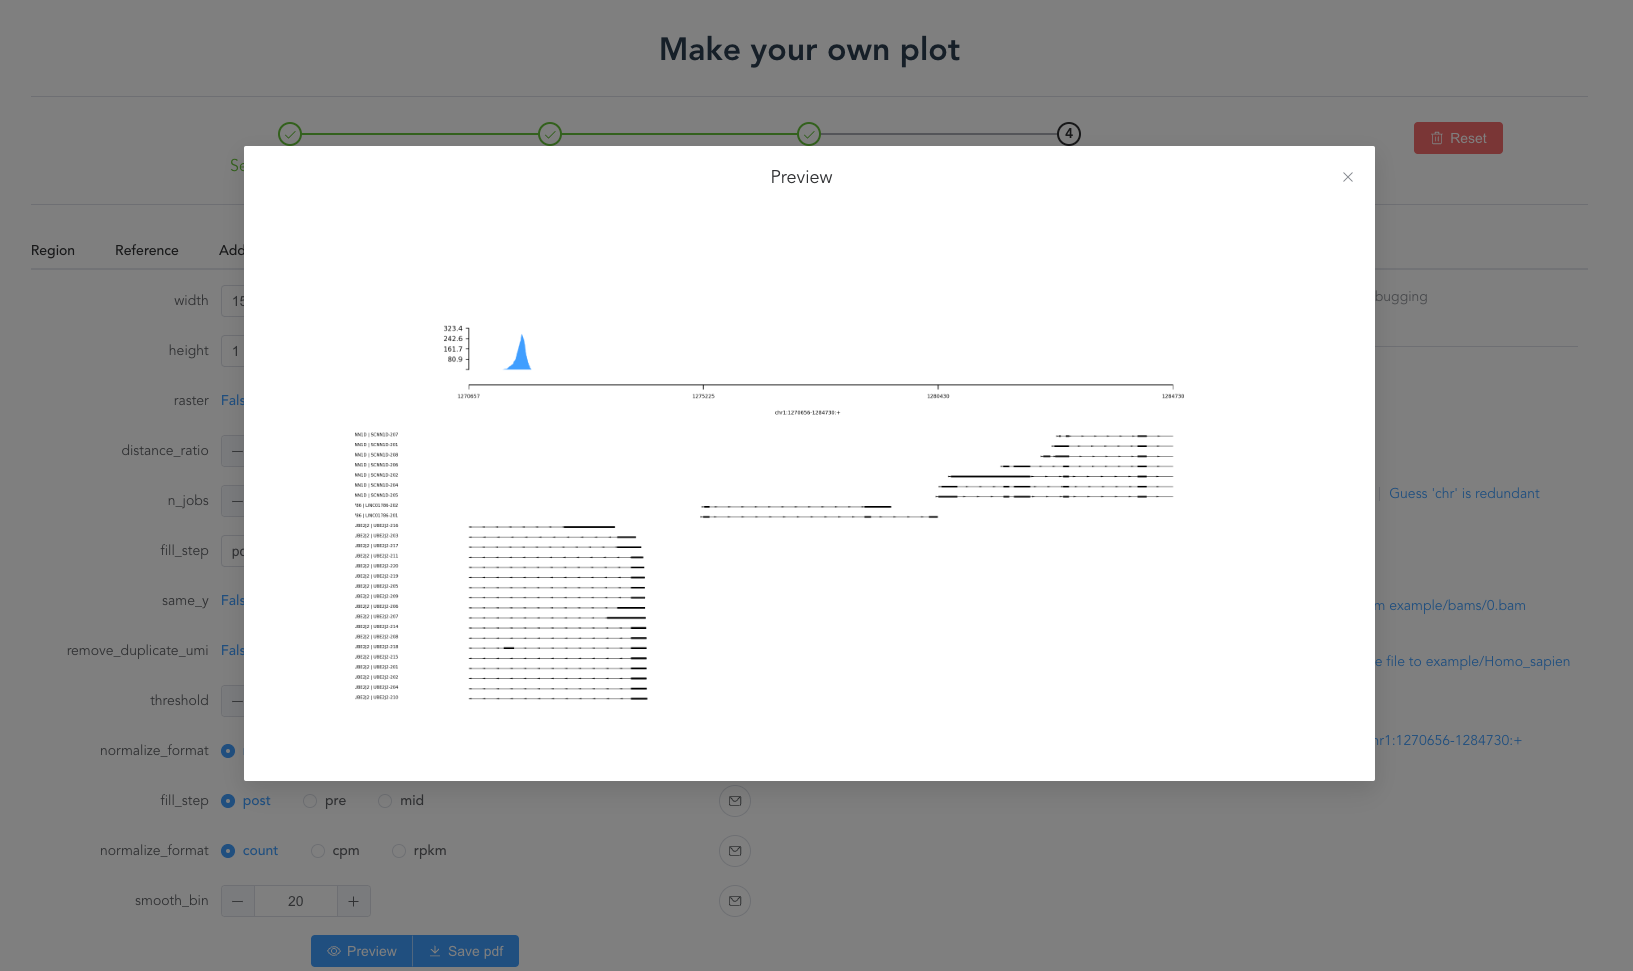
5. Draw the final plot
After completing our configuration,user could define the parameter for output.
In addition to output the plot, the server provide preview option for user to quickly check the current configuration.
Once unexpected error happened, users could download the log file and create and issue on GitHub for us to debug.

6. Preview image will display under the draw section